


Cricketing statisticians Paul and Janice Webb have just released their eagerly-awaited stats for the first half of the season in the first division and fascinating reading they make, too!
Whitland all-rounder Paul has had to admit that it is the much better half who does the real work (so well done Jan!) and what is perhaps is most interesting is the fact that ne fewer than seven batsmen in the top 20 have scored centuries but few bowlers have made a real impact and some have made it on to the chart by taking just 11 wickets from eight or nine matches!
Is that to do with weaker bowling in the first instance, stronger batting in the latter. or better pitches on both fronts? It would be interesting to know what current players think.
What is certain is that far more runs are being scored on a regular basis, whereas in my day a score of 140-plus was considered a good score the par now tends to be 18-plus and teams are chasing down scores of well over 200!
Narberth can boast the top two run getters in the chart as Ritchie Adams has scored 422 runs in only eight innings whilst just behind him is Marc Hughes, with 410 runs. Both have scored two centuries, Marc’s in successive innings, followed by Matthew Morgan and Phil Williams of Cresselly, then Peter Bradshaw and Andrew Williams (St Ishmaels).
On the bowling front, Adam James (Haverfordwest) leads with 26 wickets but is currently side-lined with a shoulder injury, followed by David Dunfee (22 for Whitland) and Andrew Miller (18 for Neyland).
There are fewer all-rounders involved in this part of the season as Andrew Williams leads the way with sixth place in batting and tenth spot in the bowling, whilst Brad McDermott-Jenkins features in ninth and 17th respectively – and Johnny Pawlett is 20th in both batting and bowling!
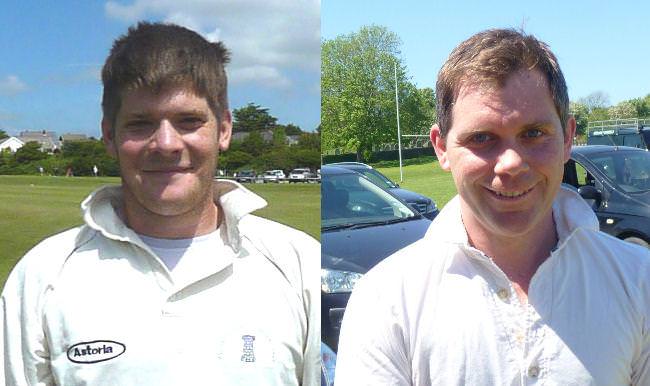
Photo:
Adam James (Left) and Ritchie Adams (Right)
Bowling Stats
| Name | Club | Overs | M'ns | Runs | Best | Ave | Wkts |
|---|---|---|---|---|---|---|---|
| Adam James | Haverfordwest | 85.4 | 15 | 268 | 6 for 29 | 10.3 | 26 |
| David Dunfee | Whitland | 74.5 | 14 | 221 | 7 for 39 | 10 | 22 |
| Andrew Miller | Neyland | 59 | 5 | 235 | 4 for 16 | 13.1 | 18 |
| Tom Davies | Carew | 75.2 | 8 | 355 | 5 for 38 | 20.9 | 17 |
| Andrew Pawlett | St Ishmaels | 78.3 | 14 | 274 | 4 for 43 | 16.1 | 17 |
| Nathan Banner | Neyland | 54 | 10 | 165 | 5 for 19 | 9.7 | 17 |
| Andrew Harries | Llangwm | 91 | 21 | 236 | 3 for 7 | 14.8 | 16 |
| Rhys Davies | Carew | 96 | 11 | 314 | 3 for 26 | 19.6 | 16 |
| Clive Tucker | Haverfordwest | 69.2 | 17 | 185 | 5 for 16 | 12.3 | 15 |
| Andrew Williams | St Ishmaels | 53.4 | 5 | 196 | 6 for 20 | 14.1 | 14 |
| Robert Webb | Cresselly | 83.1 | 11 | 342 | 5 for 35 | 26.3 | 13 |
| Nigel Morgan | Haverfordwest | 77.5 | 28 | 162 | 3 for 7 | 12.5 | 13 |
| Rob Williams | Lawrenny | 97 | 20 | 357 | 4 for 40 | 27.5 | 13 |
| Steve Lewis | Lawrenny | 33 | 11 | 271 | 4 for 24 | 20.8 | 13 |
| Mark Lee | Whitland | 81 | 24 | 245 | 3 for 47 | 18.8 | 13 |
| Chris Inward | Llangwm | 74 | 15 | 250 | 3 for 32 | 20.8 | 12 |
| Brad Jenkins | Lawrenny | 86 | 12 | 330 | 4 for 34 | 27.5 | 12 |
| James Hinchliffe | Carew | 33 | 0 | 204 | 4 for 18 | 17 | 12 |
| Stefan Jenkins | Cresselly | 51 | 6 | 213 | 4 for 39 | 19.4 | 11 |
| Matthew Johns | Narberth | 50 | 5 | 194 | 5 for 43 | 17.6 | 11 |
| Ian Hughes | Narberth | 75.2 | 20 | 186 | 4 for 45 | 16.9 | 11 |
| Jonathan Pawlett | St Ishmaels | 52 | 9 | 161 | 5 for 43 | 14.6 | 11 |
Batting Stats
| Name | Club | Runs | Innings | H/S | N/Out | 50s | 100s | Average |
|---|---|---|---|---|---|---|---|---|
| Ritchie Adams | Narberth | 422 | 8 | 126no | 3 | 1 | 2 | 84.41 |
| Marc Hughes | Narberth | 410 | 8 | 155 | 1 | 0 | 2 | 58.57 |
| Matthew Morgan | Cresselly | 398 | 9 | 112no | 1 | 4 | 1 | 49.75 |
| Phil Williams | Cresselly | 312 | 9 | 75 | 0 | 2 | 0 | 34.66 |
| Peter Bradshaw | St Ishmaels | 271 | 8 | 102no | 1 | 2 | 1 | 38.71 |
| Andrew Williams | St Ishmaels | 264 | 7 | 61 | 3 | 2 | 0 | 66.11 |
| Ben Jones | Llanrhian | 249 | 9 | 82 | 0 | 2 | 0 | 27.66 |
| Andrew Cole | Cresselly | 246 | 9 | 80no | 2 | 3 | 0 | 35.14 |
| Brad Jenkins | Lawrenny | 242 | 8 | 80 | 1 | 2 | 0 | 34.57 |
| Gareth Davies | Llanrhian | 236 | 8 | 67 | 1 | 2 | 0 | 33.71 |
| Steve Inward | Llangwm | 235 | 3 | 132no | 1 | 1 | 1 | 117.51 |
| Brian Hall | Carew | 231 | 8 | 100no | 2 | 1 | 1 | 38.5 |
| Ian Sefton | Carew | 229 | 9 | 80 | 0 | 1 | 0 | 25.44 |
| Dan Potter | Haverfordwest | 213 | 8 | 60no | 1 | 3 | 0 | 30.42 |
| Steve Lewis | Lawrenny | 209 | 8 | 82no | 1 | 2 | 0 | 29.85 |
| Robert Hicks | Carew | 209 | 9 | 49no | 2 | 0 | 0 | 29.85 |
| Ashley Sutton | Neyland | 206 | 8 | 57 | 1 | 2 | 0 | 29.42 |
| Paul Murray | Neyland | 205 | 7 | 100 | 1 | 0 | 1 | 34.16 |
| Nick Scourfield | Carew | 204 | 9 | 55 | 0 | 1 | 0 | 22.66 |
| Jonathan Pawlett | St Ishmaels | 199 | 9 | 132no | 1 | 0 | 1 | 24.87 |