 Cricket currently seems a long way away but this week it is a pleasure to once again look back on the 2013 first division scene through the statistics provided by those lovely anoraks from Whitland, Janice and Paul Webb.
Over recent years their eagerness to draw up the best bowling and batting figures has created great interest, especially since they compile them under two categories for the batting and bowling. In this way we have two tables for the batting, based on the number of runs scored and then the average runs per match played – and the same in the bowling stakes, where the tables are drawn up simply according to number of wickets taken and then the average of runs for each wicket claimed.
Major points of interest
What is immediately noticeable are three main points:
- That batsmen generally seem to have been on top because the averages are high, whilst a top wicket haul of 33 from a maximum of 17 games does not indicate great success for the bowlers!
- Only four players feature in both lists, far fewer than usual, with Rhys Davies (Carew) as the stand-out all-rounder who is fourth in the batting and ninth in the bowling stakes. The others are Gareth Davies (Llanrhian) plus Steve Lewis and Brad McDermott-Jenkins from Lawrenny.
- Despite winning all three major trophies, Neyland only have Paul Murray and Gregg Miller in the bottom half of the batting lists but three bowlers in the top ten through Nathan Banner, Nick Koomen and Andrew Miller. Draw what conclusions you will from that fact!
Top bowlers
| Name |
Overs
|
Maidens
|
Runs
|
Wickets
|
Best
|
Average
|
| Nathan Banner (Neyland) |
97.4
|
21
|
299
|
28
|
5 for 19
|
10.67
|
| Adam James (Haverfordwest) |
92.3
|
17
|
290
|
26
|
6 for 29
|
11.15
|
| Nick Koomen (Neyland) |
106.4
|
27
|
291
|
25
|
6 for 25
|
11.64
|
| Clive Tucker (Haverfordwest) |
131.4
|
25
|
416
|
29
|
5 for 16
|
14.34
|
| Christo Arundel (Llanrhian) |
79.1
|
17
|
327
|
22
|
6 for 25
|
14.86
|
| Andrew Miller (Neyland) |
121.1
|
10
|
473
|
31
|
4 for 16
|
15.25
|
| David Dunfee (Whitland) |
133.5
|
18
|
493
|
32
|
7 for 39
|
15.41
|
| Ian Hughes (Narberth) |
144.2
|
33
|
412
|
26
|
4 for 32
|
15.84
|
| Tom Davies (Carew) |
165.1
|
26
|
627
|
33
|
5 for 38
|
19.01
|
| Rhys Davies (Carew) |
158.1
|
20
|
548
|
28
|
4 for 38
|
19.57
|
| Andrew Pawlett (St Ishmaels) |
138.1
|
22
|
479
|
24
|
4 for 43
|
19.95
|
| Andrew Harries (Llangwm) |
141.1
|
24
|
475
|
23
|
3 for 7
|
20.65
|
| Bobby Webb (Cresselly) |
150.4
|
23
|
600
|
28
|
5 for 29
|
21.42
|
| Sam Harts (Cresselly) |
155.4
|
21
|
560
|
26
|
5 for 40
|
21.53
|
| Gareth Davies (Llanrhian) |
118.1
|
7
|
533
|
24
|
4 for 27
|
22.21
|
| Dean John (St Ishmaels) |
136.1
|
16
|
537
|
24
|
3 for 36
|
22.37
|
| Steve Lewis (Lawrenny) |
177.1
|
25
|
618
|
26
|
4 for 24
|
23.76
|
| Brad McDermott-Jenkins (Lawrenny) |
161.1
|
16
|
644
|
23
|
4 for 32
|
28.01
|
| Rob Williams (Lawrenny) |
171.3
|
35
|
669
|
22
|
5 for 23
|
30.4
|
| Jamie Lewis (Lawrenny) |
137.1
|
14
|
695
|
22
|
4 for 29
|
31.59
|
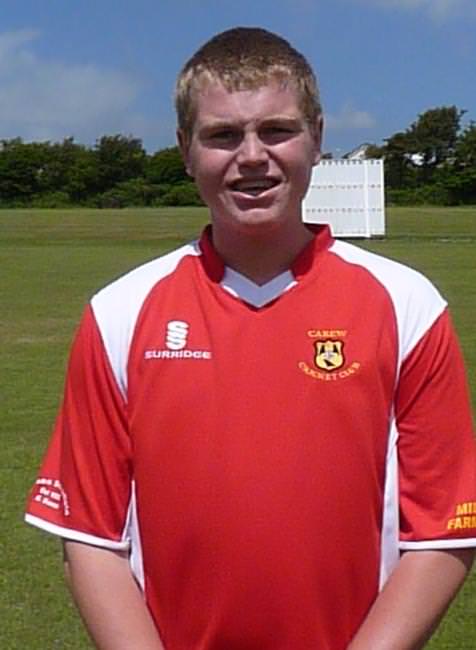 Tom Davies (Carew) claimed the most wickets (33) and David Dunfee (Whitland) was just one scalp behind and can boast the best wicket haul with a 7 for 39 haul, closely followed by Andrew Miller (31 for Neyland).
Nathan banner (Neyland), Ashley James (Haverfordwest) and Koomen (Neyland) were well in front in terms of average, as others appeared in the table despite being over 20 runs per wicket more expensive – an unusual range for the bowling averages.
And only half of the top ten bowlers managed five-wicket hauls as big scores were the order of the day.
Top batting figures
|
Name
|
Runs
|
Innings
|
Not out
|
H/S
|
50s
|
100s
|
Average
|
| Steve Inward (Llangwm) |
478
|
6
|
2
|
149no
|
2
|
2
|
119.51
|
| Simon Holliday (Haverfordwest) |
423
|
12
|
4
|
100no
|
2
|
1
|
58.87
|
| Andrew Williams (St Ishmaels) |
416
|
13
|
5
|
61
|
3
|
0
|
52.01
|
| Rhys Davies (Carew) |
405
|
13
|
5
|
121
|
3
|
1
|
50.62
|
| Ritchie Adams (Narberth) |
568
|
16
|
4
|
126no
|
2
|
2
|
47.33
|
| Brian Hall (Carew) |
413
|
15
|
6
|
100no
|
3
|
1
|
45.88
|
| Peter Bradshaw (St Ishmaels) |
562
|
16
|
2
|
131no
|
2
|
2
|
40.14
|
| Marc Hughes (Narberth) |
551
|
16
|
2
|
155
|
2
|
2
|
39.35
|
| Matthew Morgan (Cresselly) |
581
|
16
|
1
|
112no
|
5
|
1
|
38.73
|
| Ian Sefton (Carew) |
538
|
16
|
2
|
127no
|
3
|
1
|
38.42
|
| Paul Murray (Neyland) |
448
|
14
|
2
|
100
|
3
|
1
|
37.33
|
| Danny Potter (Haverfordwest) |
448
|
14
|
2
|
73
|
5
|
0
|
37.33
|
| Brad McDermott-Jenkins (Lawrenny) |
556
|
16
|
1
|
174
|
2
|
1
|
37.06
|
| Gareth Davies (Llanrhian) |
510
|
15
|
1
|
83
|
4
|
0
|
36.42
|
| Jonathan Thomas (Whitland) |
396
|
12
|
1
|
70
|
4
|
0
|
36.01
|
| Phil Williams (Cresselly) |
517
|
15
|
0
|
108
|
2
|
1
|
34.46
|
| Ben Jones (Llanrhian) |
416
|
14
|
1
|
82
|
3
|
0
|
32.01
|
| Steffan James (Whitland) |
381
|
14
|
2
|
105
|
2
|
1
|
31.75
|
| Steve Lewis (Lawrenny) |
469
|
16
|
1
|
82no
|
5
|
0
|
31.26
|
| Gregg Miller (Neyland) |
389
|
16
|
2
|
81no
|
2
|
0
|
27.78
|
 On the batting front, Steve Inward topped the averages with a massive average of 119.5 as he scored two centuries and two fifties before a damaged finger put him out of the game having played only six games for Llangwm.
Simon Holliday (Haverfordwest), Andrew Williams (St Ishmaels) and Rhys Davies all succeeded in averaging over 50 runs per innings and there were 17 scores of at least 100 as further proof that the bat triumphed over the ball.
Does this mean bowling is getting weaker? Is batting now the strong point of local cricket? How much can be attributed to quality pitches provided by earnest groundsmen?
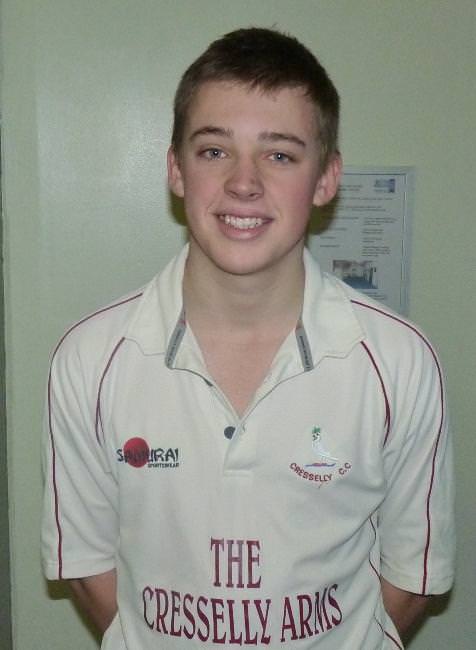
Cresselly’s talented young opener Matthew Morgan scored the most runs as he stroked 581, 13 more than Narberth’s Ritchie Adams and 19 in front of St Ishmael’s Peter Bradshaw.
And finally . . .
And finally, Neyland finished top of the number of individual performances as the afore-mentioned five featured. Most of the others had four top performers, the exceptions being Whitland (3), Narberth (3), Llanrhian (3) and Llangwm (2).